ROC curves
Full receiver operating characteristic curves for each HIPAA identifier category and clinical entity type
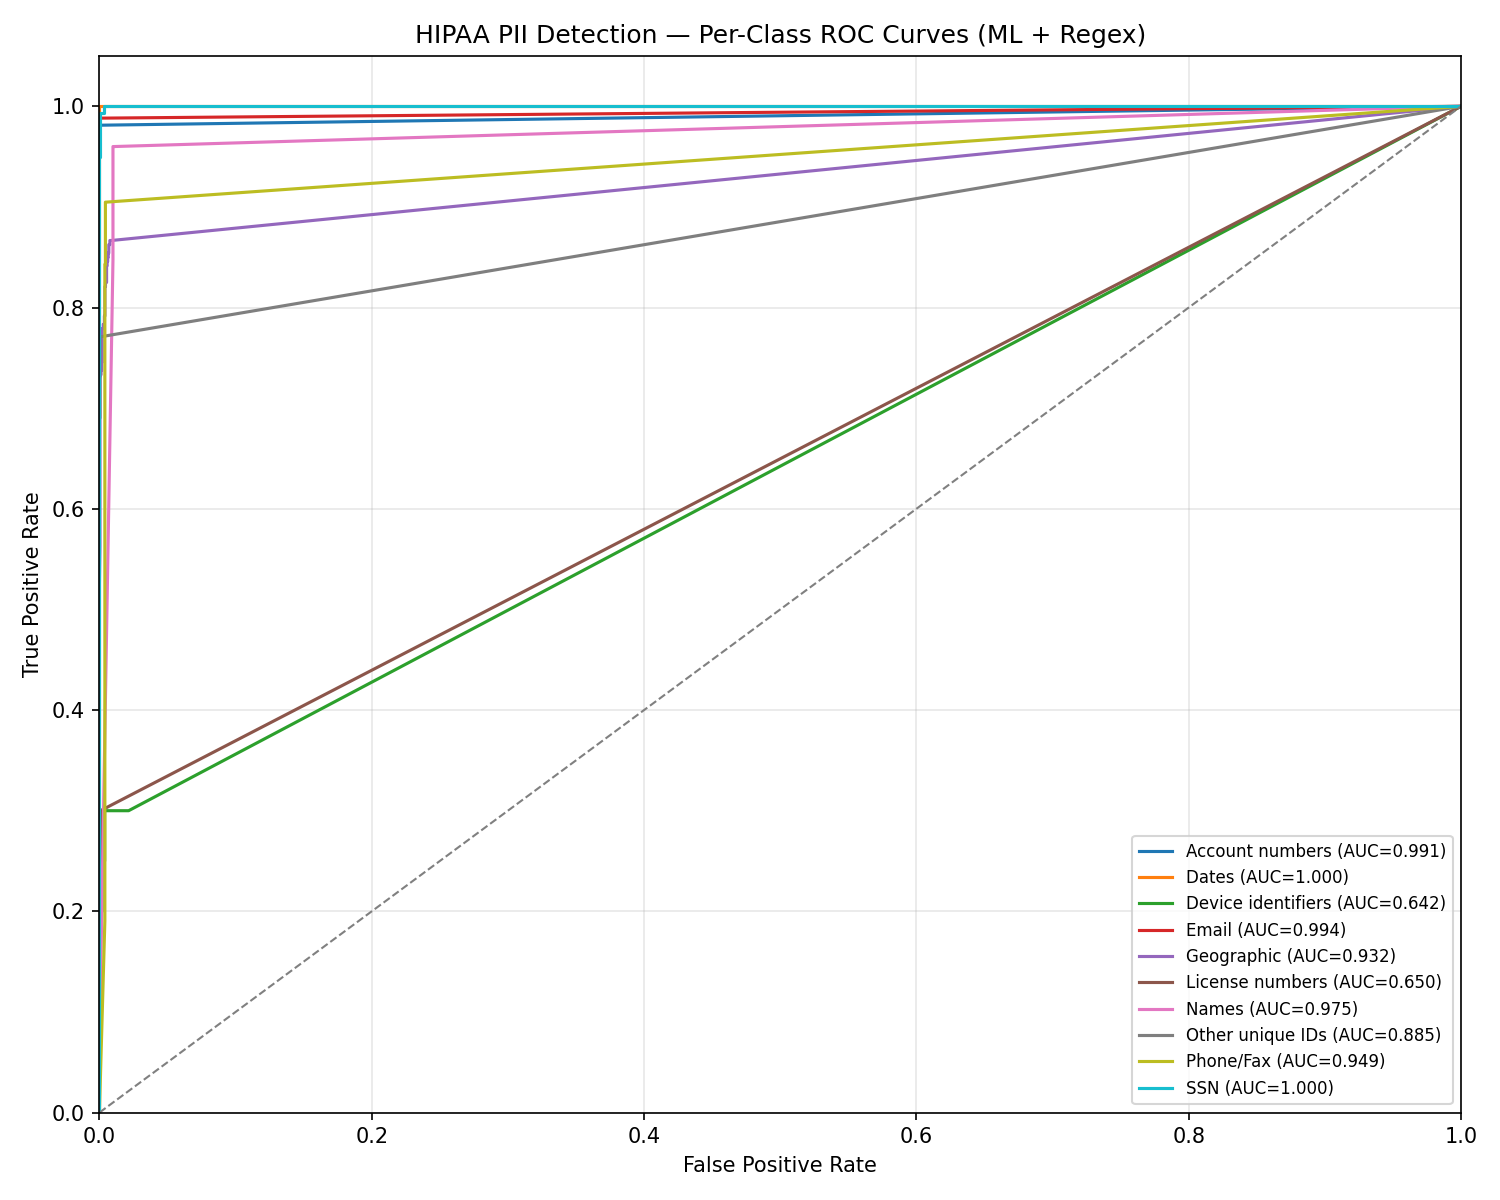
ROC curve: All HIPAA categories (overview)
All HIPAA Categories
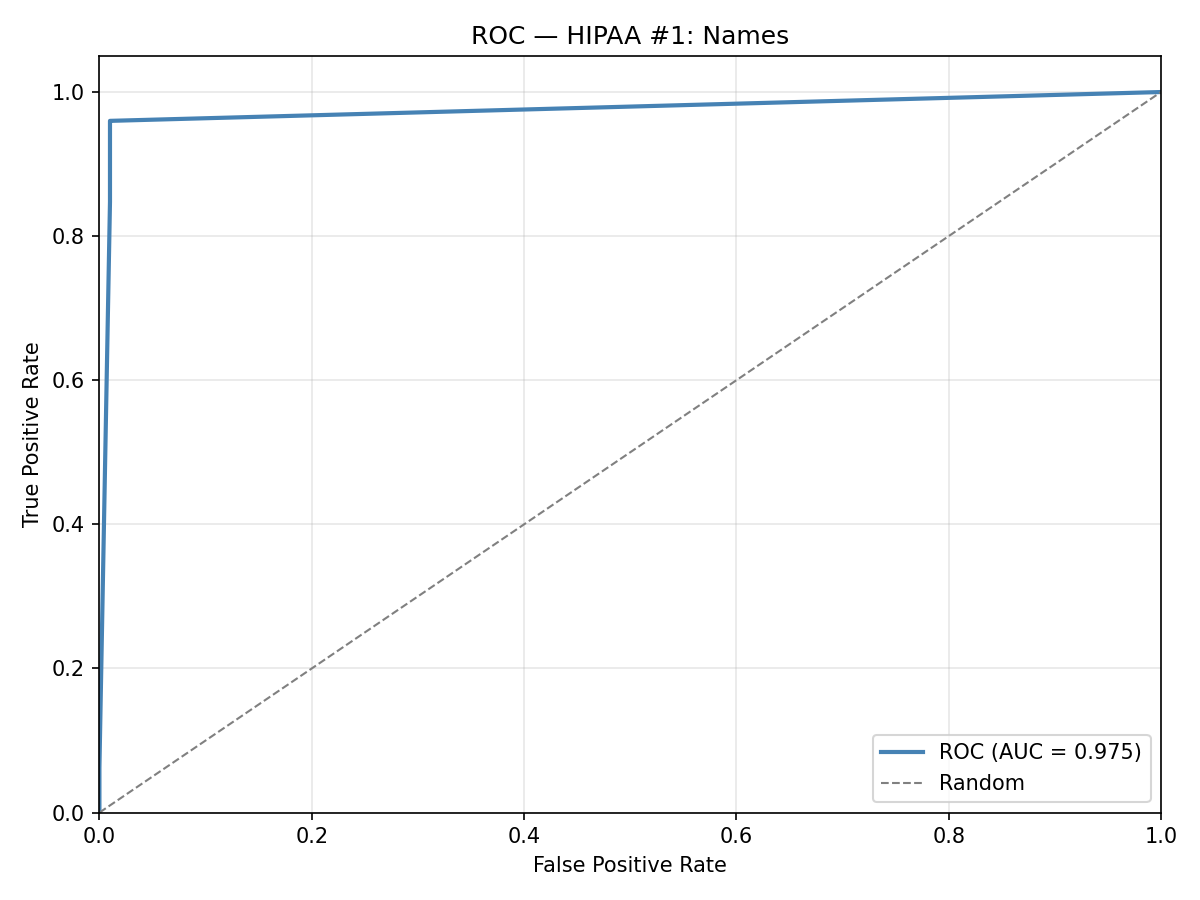
ROC curve: Names
Names AUC 0.975
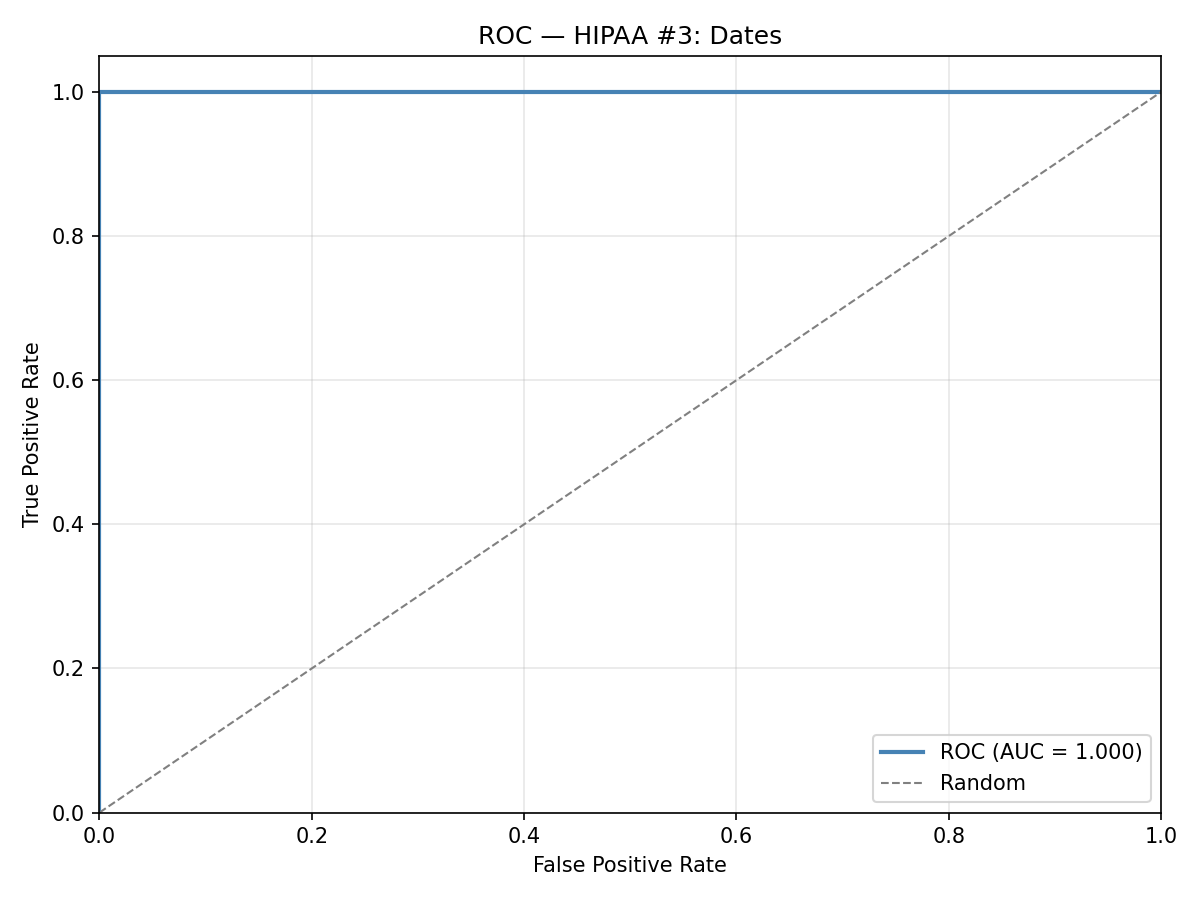
ROC curve: Dates / DOB
Dates / DOB AUC 1.000
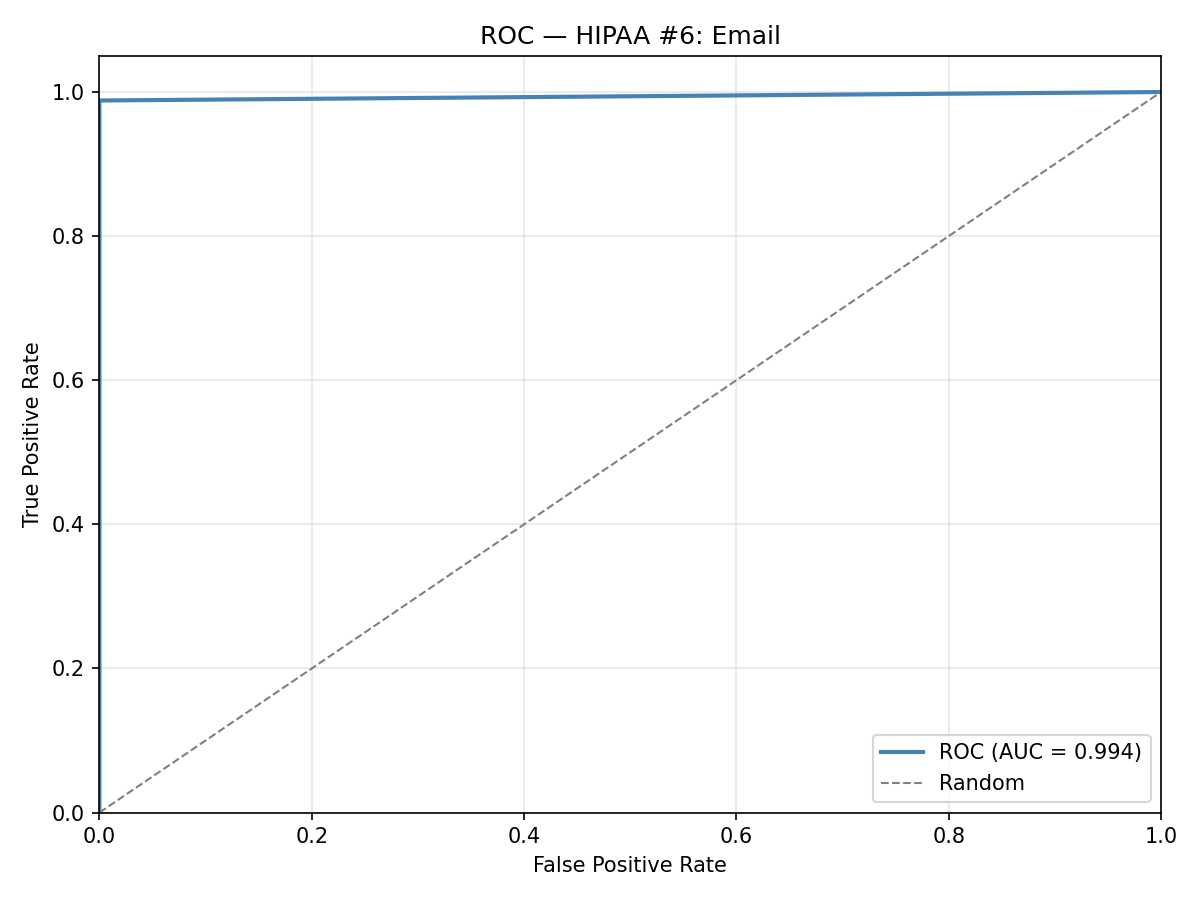
ROC curve: Email
Email AUC 0.994
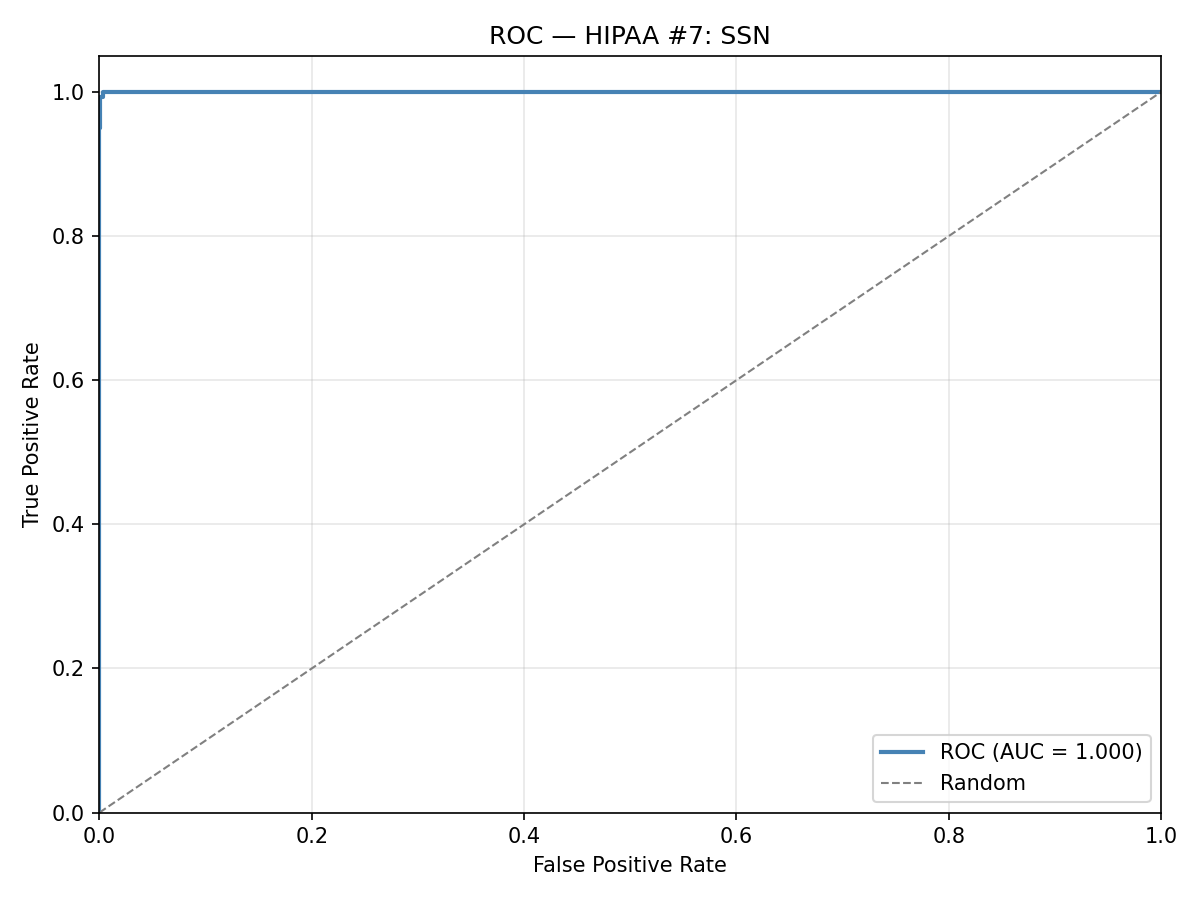
ROC curve: SSN
SSN AUC 0.999
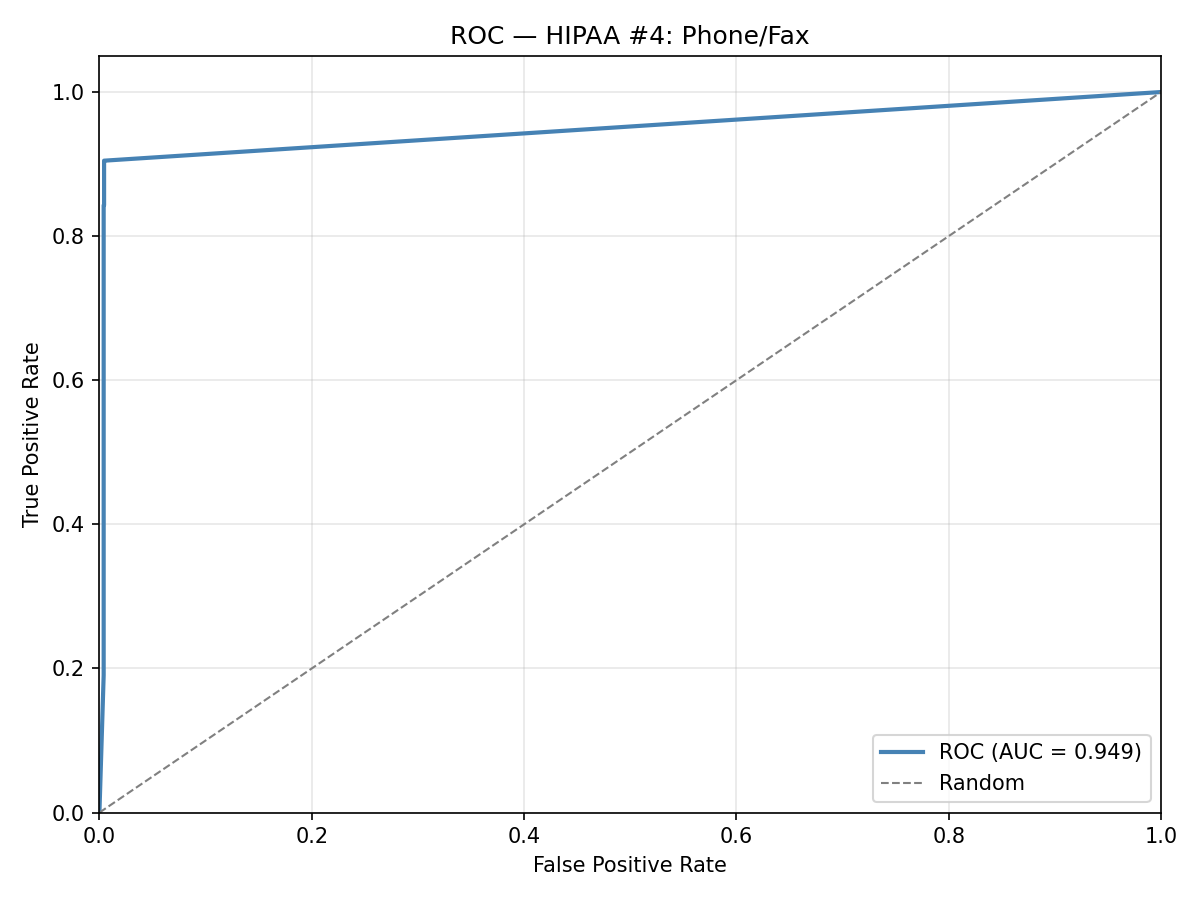
ROC curve: Phone / Fax
Phone / Fax AUC 0.949
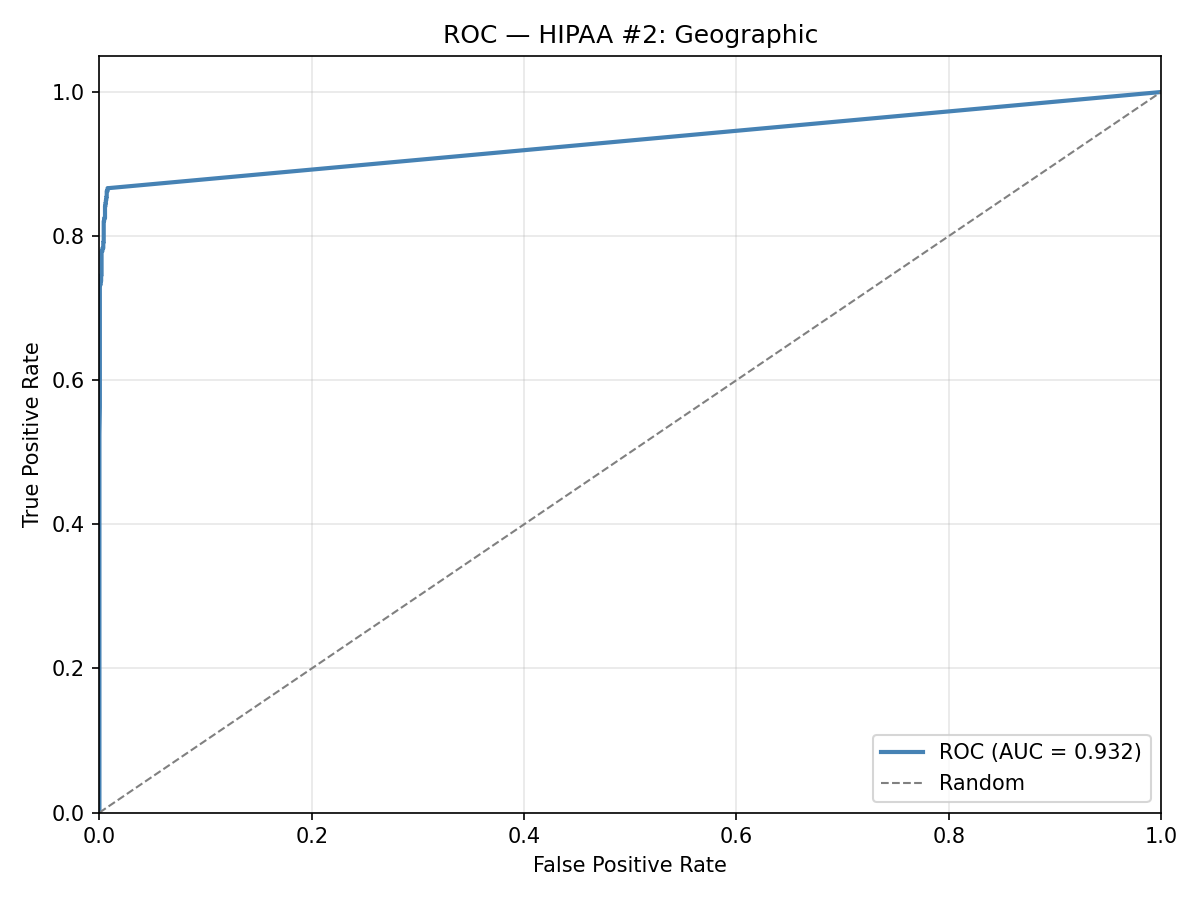
ROC curve: Geographic identifiers
Geographic AUC 0.932
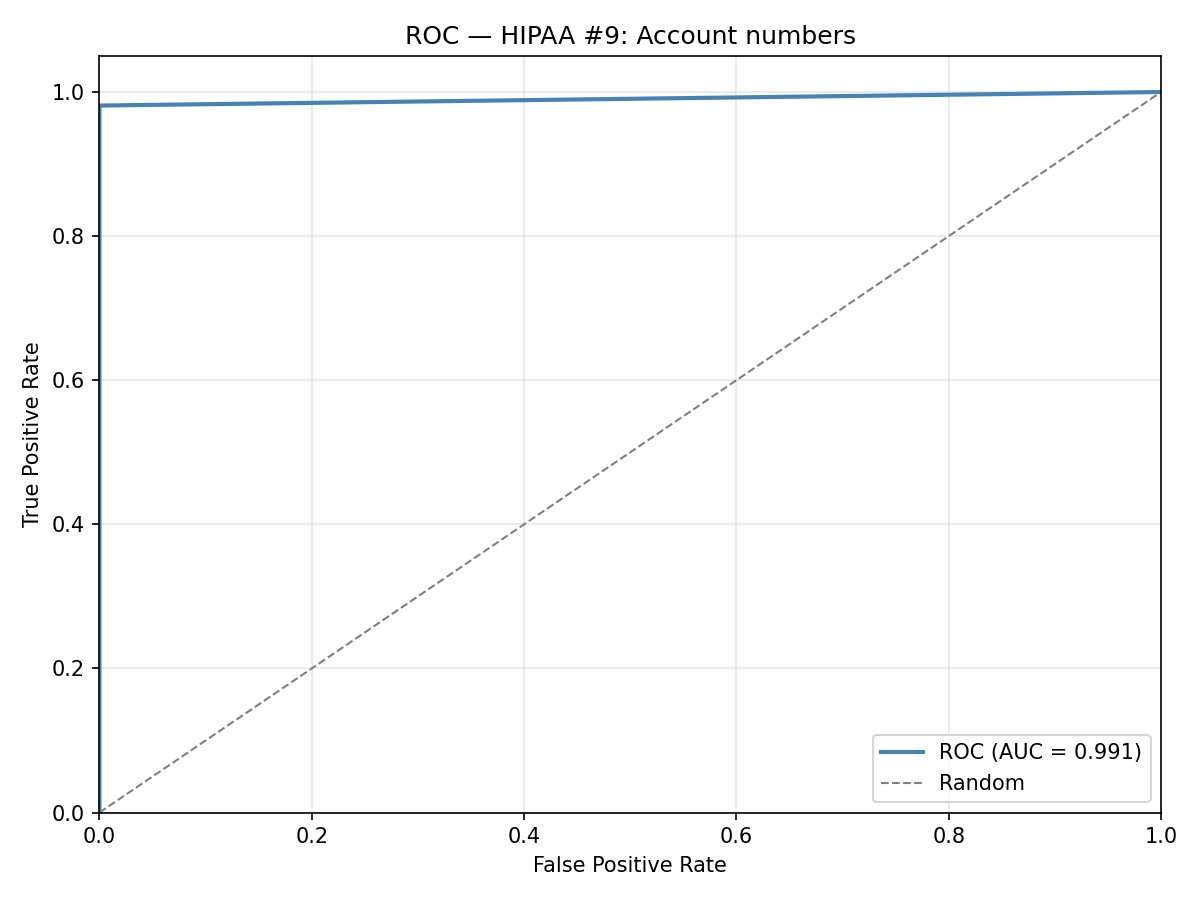
ROC curve: Account numbers
Account Numbers AUC 0.991
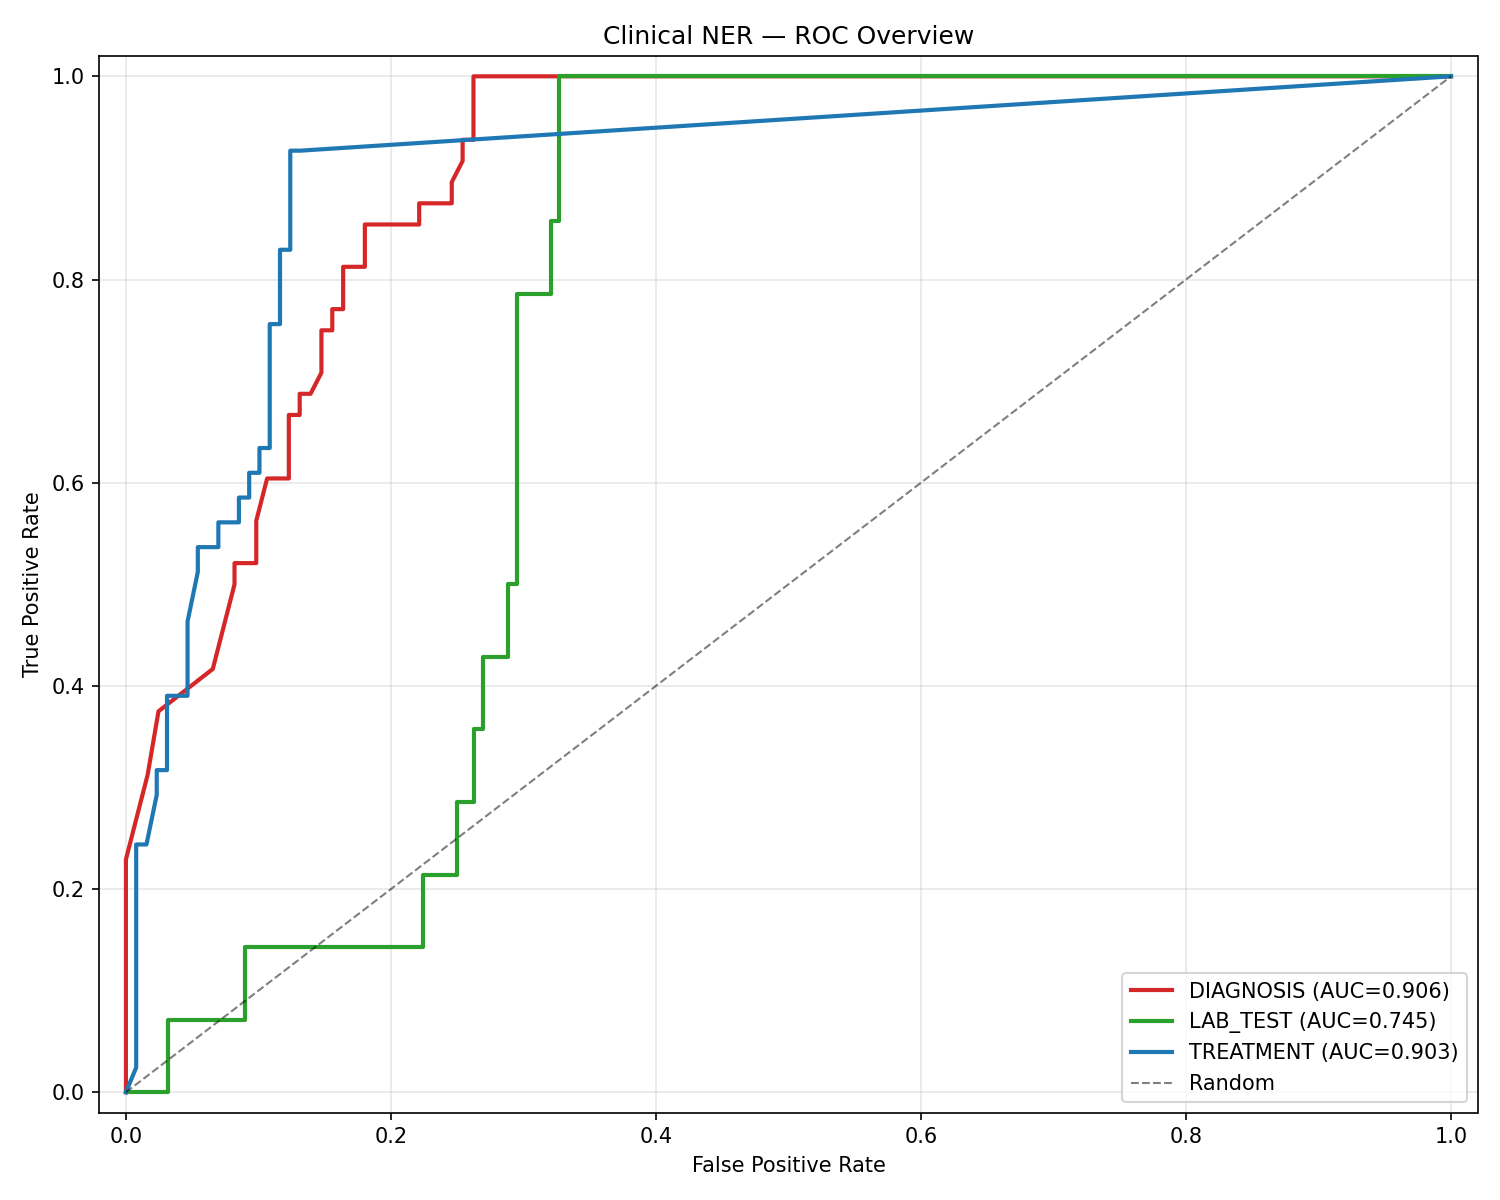
ROC curve: Clinical NER (overview)
All Clinical Entities
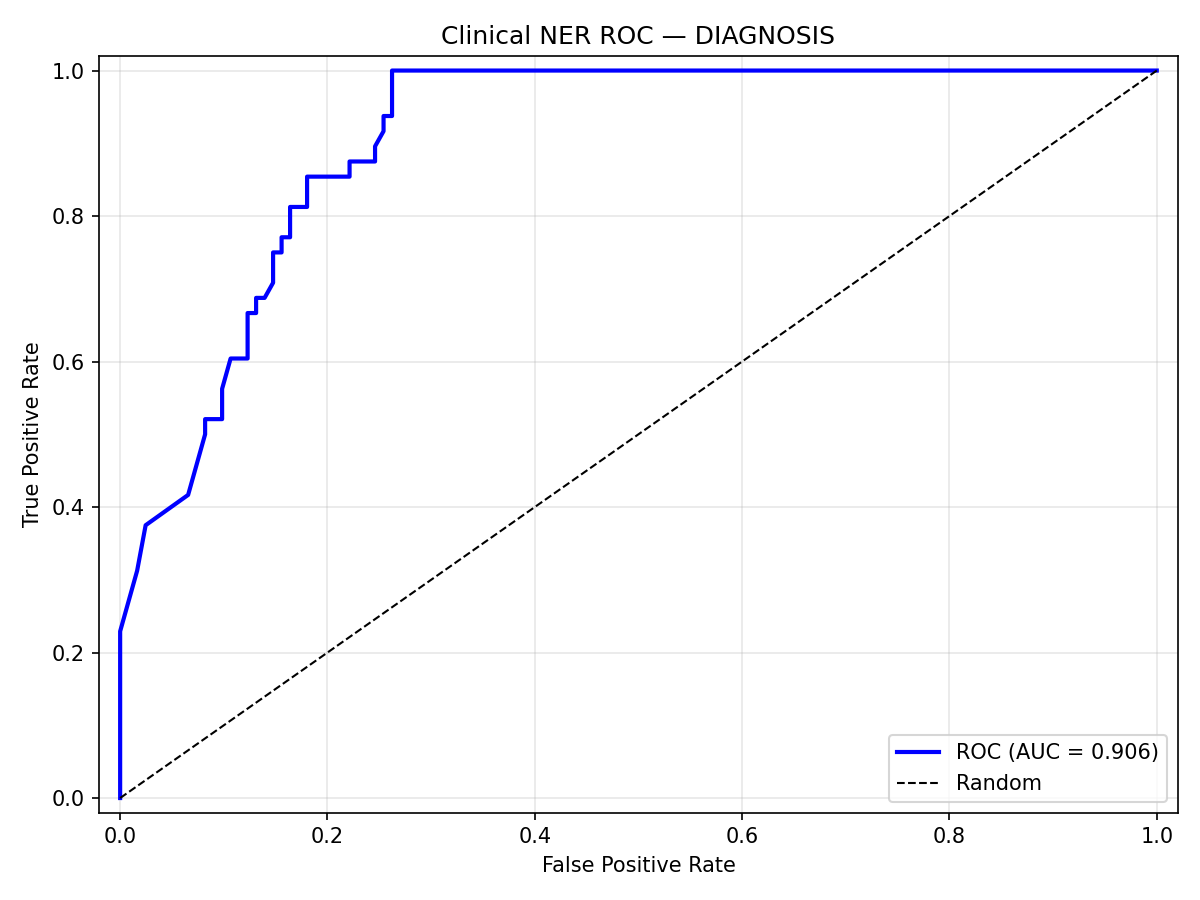
ROC curve: Diagnosis
Diagnosis AUC 0.906
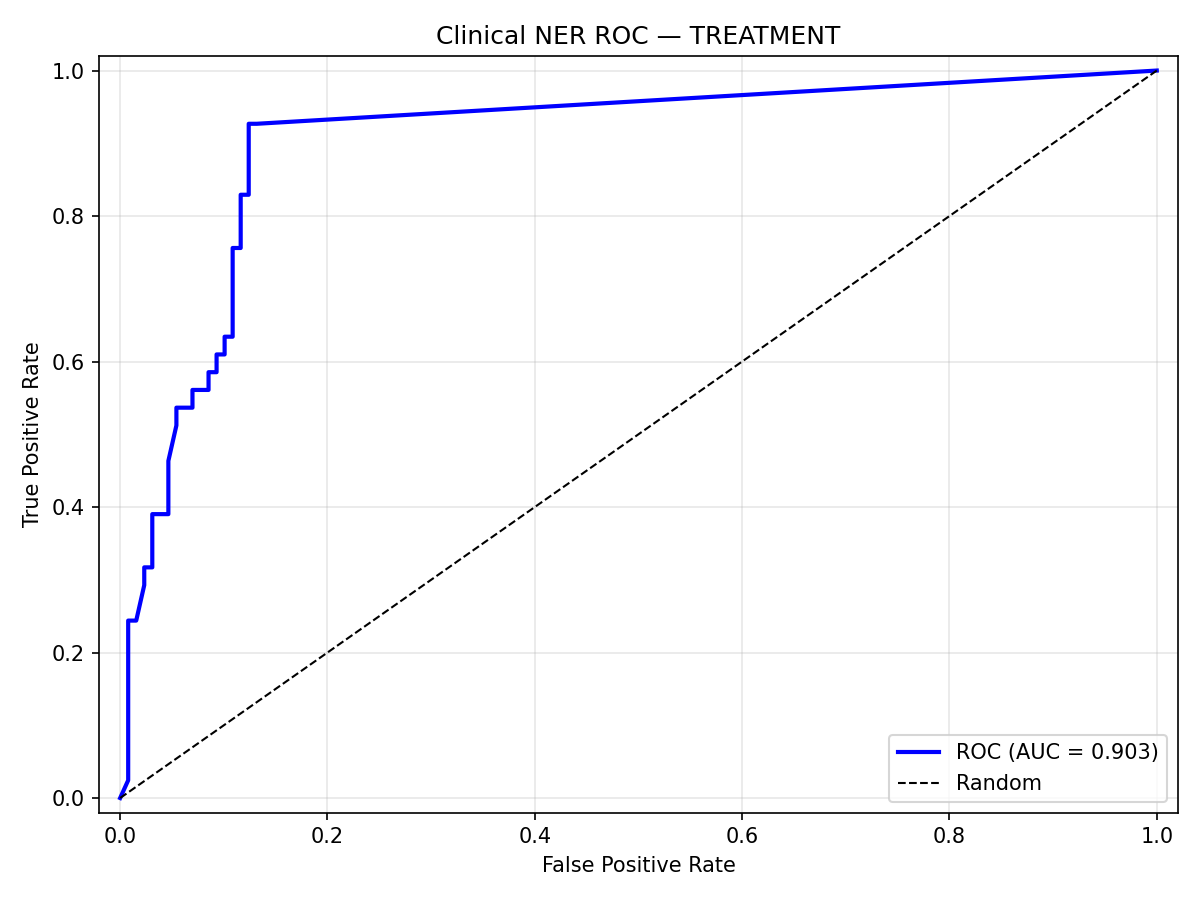
ROC curve: Treatment
Treatment AUC 0.903
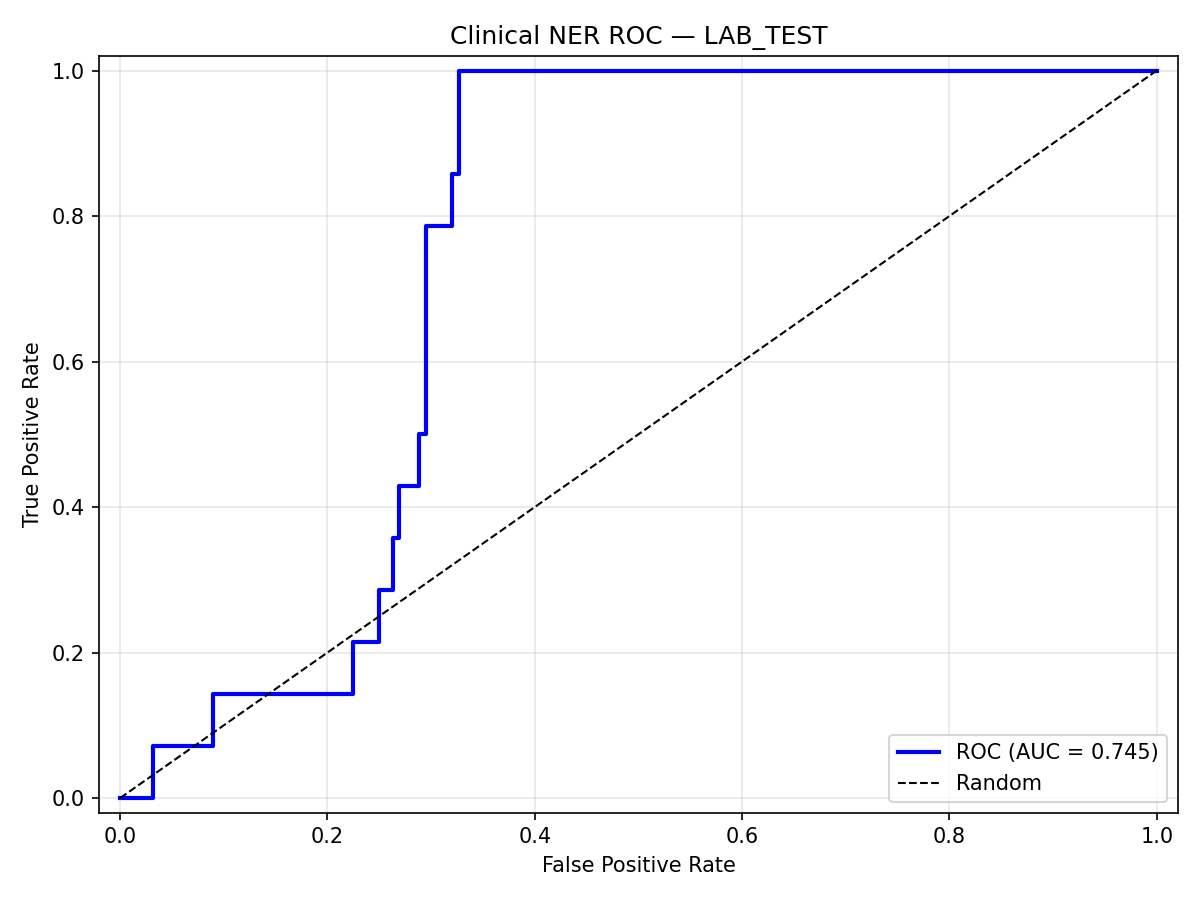
ROC curve: Lab test
Lab Test AUC 0.745